 STACEE-48 Results on Gamma Rays from the Blazar Mrk 421:
 STACEE-48 Results on Gamma Rays from the Blazar Mrk 421:
 |
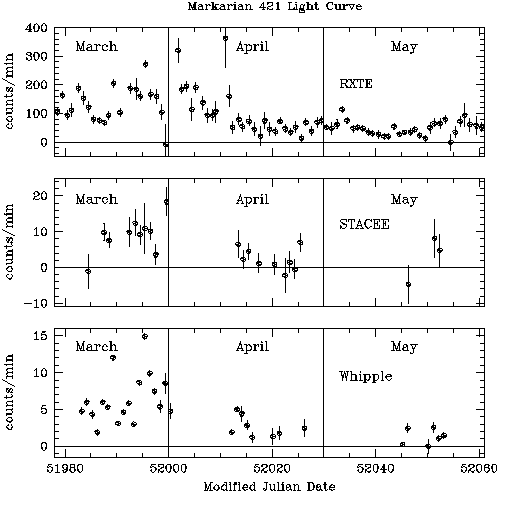
The plot to the left (Boone et al. 2002) shows the photon counting rate from the blazar Markarian 421 in three different energy bands from the early part of 2001. The STACEE detected gamma-ray rates appear in the middle frame. For comparison, the corresponding X-ray rates (photons with energies between 2 and 10 keV) from the RXTE satellite's All Sky Monitor appear in the top frame, and TeV gamma-ray rates from the Whipple detector (Holder et al. 2001) appear in the lower frame. Note that the rates in all three energy bands appear well correlated. The gaps in the coverage occur around the full Moon, when detectors such as STACEE and Whipple generally do not operate. |
 |
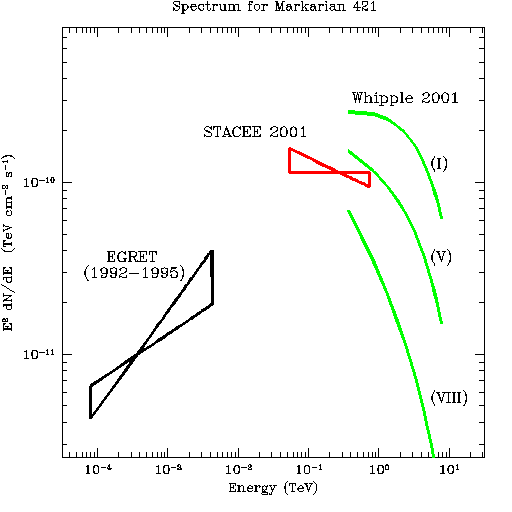
The plot to the left (Boone et al. 2002) is a spectral energy distribution for Markarian 421 composed of observations by three different instruments during various epochs. The EGRET data, taken from the third EGRET catalog (Hartman et al. 1999), include cycles 1 through 5, and are thus representative of an average low-flux state. The Whipple curves are taken from Krennrich et al. (2002), and represent a high (I), medium (V), and low flux (VIII) state during the 2001 flare. The STACEE butterfly corresponds to a range of power-law spectra that would yield the average gamma-ray rate observed by STACEE during the 2001 flare. |
Click here to go to a full list of publications and talks.